To validate cell-surface binding after nanobody screening, test the candidate on live target-positive and target-negative cells, include a nonbinding control and competition control, then confirm the result with an orthogonal method such as BLI, SPR, or microscopy. This workflow addresses three common needs: cell-surface nanobody validation, Membrane Target Nanobody Screening, and live-cell flow cytometry binding. A positive signal alone is not enough because dead cells, Fc-receptor interactions, fluorescent aggregates, receptor overexpression, or avidity can create misleading results.
Researchers usually reach this stage after phage display, yeast display, ribosome display, or another nanobody screening campaign. The practical question is not simply “does the clone bind?” but “does it recognize the intended epitope on the native membrane protein under biologically relevant conditions?” The answer requires a staged comparison of specificity, concentration dependence, competition, affinity, and cellular localization.
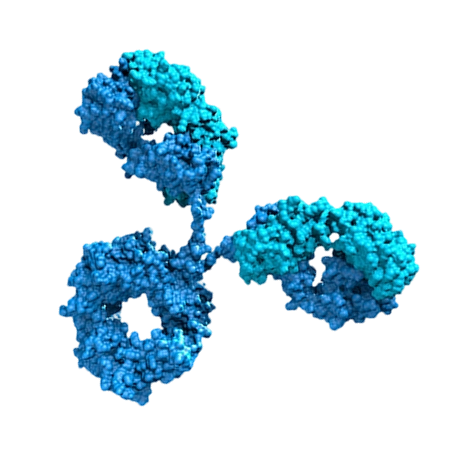
A convincing validation package should separate five properties:
- Target dependence: binding is higher on cells expressing the intended membrane protein than on matched negative cells.
- Live-cell accessibility: the nanobody recognizes the extracellular form of the target without fixation or permeabilization.
- Specificity: excess unlabeled nanobody, ligand, or antibody reduces the signal when they compete for the same or an overlapping epitope.
- Concentration dependence: binding increases with nanobody concentration and approaches a plateau rather than rising only because of nonspecific adsorption.
- Orthogonal confirmation: the interaction is supported by a second assay that measures either purified-protein affinity or cellular localization.
These criteria are important because recombinant ectodomains may expose surfaces that are hidden, incorrectly folded, glycosylated differently, or structurally incomplete on living cells. A nanobody can show strong binding to an isolated antigen and still fail to recognize the native membrane target.
What Cell-Surface Nanobody Validation Must Prove
A relevant published example is the anti-HER2 nanobody 2Rs15d, which was developed for HER2-targeted imaging and drug-delivery research. Its translational value depended on recognition of HER2 in a cellular context rather than binding to purified protein alone. Studies of HER2-targeting nanobodies have used cell-binding experiments together with biochemical and imaging methods before advancing to preclinical applications. The case illustrates a key principle: a screened clone becomes useful only after native-receptor binding, specificity, and tissue or cellular localization have been examined independently.
This is a published research example, not a personal anecdote or a claim that every anti-HER2 clone behaves identically. Teams working with 阿帕克 or another nanobody development platform should treat the published case as a validation model, then reproduce the relevant controls with their own clone, cell line, target density, label, and assay format.
Published Research Case: Membrane Target Nanobody Screening Followed by Cellular Validation
Required Materials for Cell-Surface Nanobody Validation
- Target-positive live cells with documented expression of the membrane protein.
- A target-negative cell line, parental cell line, knockout line, or knockdown control whenever available.
- Purified nanobody with an identity record, concentration measurement, purity data, and endotoxin information if cells are sensitive to endotoxin.
- Detection reagent, such as a directly labeled nanobody, anti-tag antibody, fluorescent secondary antibody, or site-specific fluorophore conjugate.
- Flow cytometer with appropriate laser and detector configuration, or a fluorescence microscope for localization studies.
- Binding buffer that preserves cell viability and minimizes nonspecific adsorption.
- Viability dye, single-color controls, fluorescence-minus-one controls where appropriate, and an unstained control.
- Positive binding control, negative nanobody control, and reagent-only control.
- Optional orthogonal tools: BLI or SPR instrument, purified antigen, receptor-blocking antibody, native ligand, or competition reagent.
Before starting, verify that the target-positive and target-negative cells differ in target expression under the exact culture conditions used for testing. Expression can change with passage number, confluence, differentiation state, induction level, or proteolytic shedding. Confirming surface expression with an independent antibody or ligand is preferable to relying only on the original screening annotation.
Materials for Membrane Target Nanobody Screening Confirmation
Step-by-Step Cell-Surface Binding Validation Workflow
Step 1: Confirm Target Expression Before Membrane Target Nanobody Screening Validation
Tools: target-specific antibody or ligand, live-cell flow cytometry, viability dye, target-positive and target-negative cells.
Action: Analyze the target-positive and control cells in their live, non-permeabilized state. Use the same cell-handling procedure planned for nanobody testing. Record the median fluorescence intensity or another prespecified population-level metric rather than relying only on representative plots.
Parameters: Keep the temperature, cell density, buffer, incubation duration, and washing procedure consistent across all samples. Use the antibody or ligand according to its validated protocol, and document the lot, concentration, and instrument settings.
Check: The target-positive population should show a reproducible surface-expression signal relative to the negative control. Assess viability and exclude debris and doublets during analysis.
Failure fix: If the expected expression difference is absent, do not interpret nanobody binding yet. Check cell identity, passage history, induction conditions, receptor shedding, antibody performance, and gating. A failed expression check is a prerequisite problem, not evidence that the nanobody lacks affinity.
Step 2: Prepare a Low-Background Nanobody Binding Assay
Tools: purified nanobody, binding buffer, low-binding tubes or plates, labeled detection reagent, wash buffer, and viability dye.
Action: Prepare a concentration series covering the validated working range of the nanobody. Include the same concentration series for a nonbinding nanobody or irrelevant nanobody with the same tag and labeling strategy.
Parameters: Use a single buffer system and identical cell numbers across samples. Keep labeling chemistry, incubation temperature, incubation time, and wash number constant. If the nanobody is detected through an anti-tag reagent, include anti-tag-only controls because tag-mediated background can be substantial.
Check: The reagent-only and irrelevant-nanobody controls should establish the background distribution. A clean assay normally shows a measurable separation between target-positive cells and controls before more detailed curve fitting is attempted.
Failure fix: If background is high, reduce the detection reagent concentration according to its validated titration, improve washing, remove aggregates by suitable filtration or centrifugation, reduce cell stress, and test a site-specific labeling strategy. Do not solve high background by simply increasing the nanobody concentration.
Step 3: Measure Live-Cell Binding by Flow Cytometry
Tools: flow cytometer, viability dye, single-stain controls, target-positive and target-negative cells, and nanobody concentration series.
Action: Incubate live cells with each nanobody concentration and process target-positive, target-negative, unstained, detection-only, and irrelevant-nanobody controls in parallel. Gate sequentially on cells, singlets, and viable cells before measuring the nanobody-associated fluorescence.
Parameters: Use the same acquisition template for every sample. Record the number of acquired events, detector settings, compensation or unmixing method, cell viability, and gating boundaries. The most useful primary readout is usually the median fluorescence intensity of the viable singlet population, although the percentage of positive cells can provide complementary information.
Check: Look for three features: concentration-dependent signal, higher binding on target-positive cells than on negative cells, and low signal from the irrelevant nanobody. Repeat the experiment with independent biological cell preparations rather than counting technical repeats from one tube as independent evidence.
Failure fix: If the signal appears only at the highest concentration, suspect nonspecific adsorption, aggregation, or an inadequate detection ratio. If positive and negative cells overlap, confirm receptor expression, check the nanobody tag, test a different labeling format, and evaluate whether the epitope is absent or inaccessible on the chosen cell line.
Step 4: Test Specificity with Competition
Tools: unlabeled nanobody, labeled nanobody, receptor-specific antibody, native ligand, or another validated competitor.
Action: Preincubate cells with an excess of unlabeled nanobody or a known target-binding reagent, then add the labeled nanobody. Include a no-competitor control and a nonspecific competitor control.
Parameters: Use a fixed labeled-nanobody concentration selected from the informative part of the binding curve. Keep the preincubation order, temperature, duration, and wash procedure identical between samples. The competitor should be tested at a concentration demonstrated to bind the target under the same assay conditions.
Check: A reduction in cell-associated fluorescence supports target-mediated binding. If the known antibody or ligand blocks the nanobody, the epitopes may overlap or binding may cause steric interference. Lack of competition does not automatically prove nonspecificity because the reagents may recognize distinct epitopes.
Failure fix: If competition is incomplete, verify competitor activity on the same cells, increase the number of competitor conditions within the validated assay range, and examine whether the receptor is multimeric or highly expressed. If the nanobody signal is unchanged by every competitor and remains similar on negative cells, prioritize aggregation and nonspecific binding as explanations.
Step 5: Confirm Surface Localization with Microscopy
Tools: fluorescence microscope or confocal microscope, live-cell-compatible labeling reagent, temperature-controlled stage if needed, and membrane marker.
Action: Incubate live target-positive and negative cells with the nanobody under the same conditions used for flow cytometry. Image cells before fixation when the question is extracellular binding. If internalization is also being studied, separate the surface-binding experiment from the uptake experiment.
Parameters: Use identical exposure, gain, laser power, objective, and image-processing settings across conditions. Acquire multiple fields selected by a prespecified rule rather than choosing only cells with the strongest signal.
Check: Surface binding should appear at the plasma membrane or cell perimeter and should be reduced in target-negative or competed conditions. A diffuse intracellular signal may indicate uptake, membrane damage, nonspecific labeling, or imaging of fixed and permeabilized cells.
Failure fix: If membrane localization is unclear, reduce labeling density, confirm cell viability, use a membrane marker, acquire z-stacks, and avoid permeabilization during the surface-binding test. Do not interpret intracellular fluorescence as proof of extracellular target binding.
Step 6: Measure Purified-Protein Affinity by BLI or SPR
Tools: BLI or SPR instrument, purified extracellular domain or alternative target construct, reference sensor, running buffer, and nanobody dilution series.
Action: Measure the interaction between the nanobody and purified target using a kinetic assay. Include a reference channel or sensor, blank injections, and a nonbinding protein where appropriate.
Parameters: Choose immobilization orientation and loading levels that minimize mass-transport and rebinding artifacts. Use a concentration series that spans the expected response range. Fit association and dissociation phases only when the sensorgram quality and experimental design support kinetic interpretation.
Check: Confirm that the response is above the reference and blank signals, that replicate injections are consistent, and that the fitted model is supported by the residuals and experimental design. Report the model, fitting range, baseline treatment, and whether the reported value is an apparent or equilibrium affinity.
Failure fix: If BLI or SPR shows binding but cells do not, compare antigen folding, glycosylation, oligomerization, and epitope accessibility. If cells bind but purified antigen does not, the nanobody may recognize a conformational state, a membrane-associated complex, or a post-translational feature absent from the recombinant construct.
Step 7: Compare Binding Across Cell Lines and Target Density
Tools: several cell models with different target-expression levels, validated surface-expression assay, and flow cytometer.
Action: Test the nanobody on a panel that includes high-expression, endogenous-expression, low-expression, and target-negative cells where available. Compare nanobody fluorescence with independently measured target abundance.
Parameters: Use the same nanobody concentration, cell-handling procedure, acquisition settings, and analysis pipeline across the panel. Analyze the relationship between target density and nanobody binding rather than comparing raw fluorescence from unrelated experiments.
Check: A target-dependent pattern strengthens the conclusion that the nanobody recognizes the intended receptor. A mismatch may reveal receptor conformation differences, epitope masking, glycosylation effects, or a secondary binding partner.
Failure fix: If binding is strong only in an overexpression system, repeat the study with an endogenous model. If endogenous cells bind weakly, determine whether the issue is low receptor density, poor accessibility, receptor cleavage, or a cell-line-specific membrane environment.
How to Analyze Cell-Surface Nanobody Binding Data
Use a prespecified analysis plan. Report the raw or transformed fluorescence metric, background subtraction method, gating strategy, number of biological replicates, target-expression confirmation, and control performance. Avoid presenting a single representative flow plot without quantitative summaries.
Useful comparisons include:
- Target-positive versus target-negative median fluorescence.
- Labeled nanobody versus irrelevant nanobody.
- Nanobody with competitor versus nanobody without competitor.
- Live-cell surface staining versus fixed or permeabilized staining.
- Binding signal versus independently measured receptor abundance.
Do not equate a high fluorescence signal with high affinity. Fluorescence can be influenced by labeling ratio, fluorophore brightness, receptor density, multivalency, internalization, nonspecific adsorption, and secondary-reagent amplification. BLI or SPR can estimate molecular interaction parameters, whereas flow cytometry measures binding in the context of a cell surface. The two assays answer related but different questions.
Common Membrane Target Nanobody Screening Errors and Fixes
Using Fixed or Permeabilized Cells Too Early
Fixation can alter membrane conformation and permeabilization can expose intracellular proteins. Start with live, non-permeabilized cells when the intended application involves an extracellular epitope.
Relying on a Positive Cell Line Without a Negative Control
Overexpression does not prove specificity. Use a parental, knockout, knockdown, or unrelated cell line and confirm target expression independently.
Ignoring Nanobody Aggregation
Aggregated protein can increase apparent cell binding and produce broad flow-cytometry distributions. Inspect sample quality with an appropriate analytical method, review purification records, and compare freshly prepared material with stored material.
Confusing Tag Binding with Nanobody Binding
Anti-His, anti-FLAG, anti-HA, and other tag reagents can generate background or bind unexpected cellular components. Test the tag reagent without nanobody and include an irrelevant nanobody carrying the same tag.
Using Only One Cell Line
A single model cannot distinguish target dependence from a cell-line-specific interaction. A small panel containing positive, negative, and endogenous-expression models provides stronger evidence.
Interpreting Competition Too Rigidly
Incomplete competition may reflect distinct epitopes, receptor density, avidity, or insufficient competitor activity. Treat competition as one component of the evidence rather than a standalone pass-or-fail test.
Calling Internalization Surface Binding
Flow cytometry and microscopy can measure total cell-associated fluorescence unless the protocol distinguishes surface from internalized material. Use a validated quenching, stripping, temperature-shift, or pulse-chase strategy when internalization is part of the research question.
Recommended Decision Framework for Cell-Surface Nanobody Validation
A candidate is ready for more advanced development when it shows reproducible binding to live target-positive cells, clearly reduced binding on an appropriate negative control, low signal from an irrelevant nanobody, evidence of concentration dependence, and support from competition or an orthogonal assay. Candidates that pass purified-protein affinity testing but fail on cells should not be discarded automatically; they may recognize an inaccessible or non-native epitope. Conversely, candidates that bind cells but fail orthogonal testing require careful investigation of aggregation, receptor complexes, and assay artifacts.
For each clone, maintain a validation record containing clone identifier, sequence version, tag and labeling chemistry, protein concentration method, cell identity, passage information, target-expression data, flow-cytometry gating, raw files, control results, competition conditions, microscopy settings, and BLI or SPR fitting details. This record makes results transferable between laboratories and helps teams such as 阿帕克-supported development groups compare candidates without changing the definition of success midway through the project.
Summary and Practical Suggestions for Membrane Target Nanobody Screening
Cell-surface binding after nanobody screening should be validated in layers: first confirm native target expression, then test live-cell binding with target-positive and target-negative controls, followed by competition, microscopy, and BLI or SPR when appropriate. Use independent biological repeats, preserve raw data, and distinguish affinity from fluorescence intensity. The most reliable candidate is not necessarily the clone with the brightest signal; it is the clone whose binding remains target-dependent, reproducible, surface-accessible, and interpretable across complementary assays.
Before advancing a clone, ask four questions: Does it bind the native receptor on living cells? Is the signal absent or substantially reduced in a matched negative model? Can the interaction be competed or localized to the membrane? Is the result supported by an independent biochemical or cellular method? Answering these questions provides a defensible basis for selecting nanobodies for diagnostics, imaging, receptor modulation, or targeted delivery.
Selected literature for further checking: Hamers-Casterman et al., Nature, 1993, on naturally occurring heavy-chain antibodies in camelids; Muyldermans, Annual Review of Biochemistry, 2013, on nanobodies and single-domain antibodies; and published HER2-targeting nanobody studies involving 2Rs15d and related cellular or imaging validation workflows. Always verify the original methods and applicability to the target, cell model, and nanobody format used in your laboratory.



 Yeast Display VHH Discovery Service
 Immunogen Design & Production
 Premade Library Screening
 Phage Display Nanobody Discovery Service
 Animal Immunization
 Yeast Display Peptide Library Screening

 Nanobody Discovery for ADC
 Nanobody Discovery for Membrane Targets
 Nanobody Discovery for Cell Therapy
 TCR-Mimic Nanobody Discovery


 Antibody Affinity Maturation Service
 Nanobody Humanization Service