Which Binding Metrics Matter After Yeast Display VHH Screening
Oct.09,2026
Share:
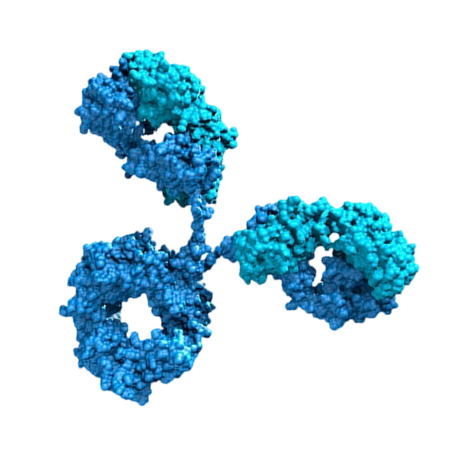
Which Binding Metrics Matter After Yeast Display VHH Screening refers to the quantitative measurements used to decide whether a yeast-displayed VHH, or single-domain antibody, is suitable for further development. The most important measurements usually include equilibrium dissociation constant (KD), association rate (kon), dissociation rate (koff), binding specificity, epitope competition, and assay reproducibility. In practice, these data help a biopharmaceutical team rank candidates, reduce false positives, and select VHHs with a realistic chance of becoming diagnostic reagents, research tools, or therapeutic leads. A well-designed Yeast Display VHH Screening Service converts a large hit pool into a smaller, evidence-based candidate panel.
Binding kinetics, specificity, and reproducibility should be reviewed together after VHH screening.
Why Post-Screening VHH Analysis Became Essential
Yeast surface display emerged from the broader development of display technologies that connect genotype with phenotype. In this platform, VHH sequences are expressed on the surface of yeast cells, while fluorescence-activated cell sorting (FACS) enriches cells that bind a target antigen. The method can evaluate thousands to millions of variants in a relatively small number of screening cycles.
However, enrichment is not the same as validated affinity. A clone may become abundant because it is highly expressed on the yeast surface, binds nonspecifically to the antigen carrier, or benefits from avidity effects caused by multivalent presentation. This is why post-screening characterization is a critical transition between discovery and development.
For organizations using an NBbiolab Yeast Display VHH Screening Service, the commercial value is clear: reliable ranking data can prevent weak candidates from entering expensive recombinant expression, purification, animal studies, or assay-development programs. It also creates a traceable decision record for project teams, quality groups, and investors.
Which Binding Metrics Matter After Yeast Display VHH Screening?
1. KD: The Primary Affinity Indicator
KD, or equilibrium dissociation constant, is commonly used to describe the concentration at which half of the available binding sites are occupied under defined equilibrium conditions. A lower KD generally indicates stronger apparent affinity. For example, a VHH with a KD of 2 nM usually shows stronger equilibrium binding than one with a KD of 200 nM, assuming the assays are comparable and properly controlled.
Nevertheless, KD should not be treated as an isolated pass-or-fail number. The measured value depends on temperature, buffer composition, immobilization chemistry, antigen quality, receptor density, and the kinetic model used for fitting. A credible report should include the fitting model, replicate data, concentration range, residuals, and acceptance criteria.
Early research reagent: A low-nanomolar or even sub-micromolar KD may be adequate, depending on the application.
Quantitative diagnostic assay: Affinity must be considered together with target concentration, matrix interference, and signal-to-background ratio.
Therapeutic discovery: Strong affinity is valuable, but specificity, tissue penetration, stability, and immunogenicity risk also influence selection.
2. kon and koff: Understanding Binding Behavior
kon describes how quickly a VHH associates with its target, while koff describes how quickly the complex dissociates. These parameters provide information that KD alone cannot show. In simplified terms, KD is related to the ratio of koff to kon, although real systems may involve multistep binding or mass-transfer effects.
Metric
What it indicates
Why it matters
KD
Equilibrium affinity
Supports overall candidate ranking
kon
Association speed
May affect capture efficiency at low target concentrations
koff
Complex dissociation speed
Indicates residence time and signal retention
Rmax or binding capacity
Maximum response in the assay
Helps identify loading or expression-related artifacts
A slow koff can be especially useful when a diagnostic reagent must remain bound during washing. Conversely, a fast kon may benefit assays that require rapid target capture. A candidate with an excellent KD but an unsuitable kinetic profile may perform poorly in the intended workflow.
3. Specificity and Off-Target Binding
Specificity testing asks whether the VHH recognizes the intended antigen rather than a tag, carrier protein, contaminant, homologous protein, or unrelated surface. After yeast display, testing should include negative controls such as irrelevant proteins, empty-vector yeast, tag-only controls, and matrix components relevant to the final application.
Useful specificity experiments may include:
Binding to the intended antigen in at least two assay formats.
Binding to an unrelated protein produced using the same expression system.
Cross-reactivity testing against homologous proteins or family members.
Competition with soluble antigen to confirm target-dependent binding.
Testing in serum, cell lysate, or another application-specific matrix.
A strong fluorescent signal during FACS does not prove specificity. Signal normalization against yeast expression level and inclusion of negative controls are essential parts of yeast-display nanobody affinity analysis.
4. Monovalent Binding Versus Avidity
Yeast display often presents multiple copies of a VHH on one cell. This creates the possibility of avidity, in which multiple weak interactions produce a strong overall cell-level signal. The result may make a clone appear more powerful than it is in a purified, monovalent format.
To address this issue, teams should compare:
Cell-based binding at different display levels.
Purified monomeric VHH binding using surface plasmon resonance (SPR), biolayer interferometry (BLI), or a validated ELISA.
Binding at low antigen density and high antigen density.
Signal after stringent washing and extended dissociation.
Monovalent confirmation is one of the most important steps in determining which binding metrics matter after yeast display VHH screening. Without it, a project may advance a clone whose apparent affinity depends mainly on multivalent presentation.
5. Epitope and Competition Data
Two VHHs with similar KD values may have very different value if they recognize different epitopes. Epitope binning or competition analysis can reveal whether candidates bind overlapping regions, distinct domains, or conformationally sensitive sites.
Epitope information is particularly important when:
The target has multiple functional domains.
A blocking or neutralizing mechanism is required.
A sandwich immunoassay needs two noncompeting binders.
Resistance to target mutation is a development concern.
Competition results should be reported with assay concentrations, control antibodies or VHHs, percentage inhibition, and replicate variation. A simple “binds” or “does not bind” label is usually insufficient for candidate selection.
6. Reproducibility and Assay Quality
Reproducibility is a binding metric in the broader decision-making sense. A candidate that produces a KD of 8 nM in one run and 500 nM in another requires investigation before it is ranked as a lead. Important quality indicators include replicate agreement, signal-to-noise ratio, coefficient of variation (CV), baseline stability, and goodness of fit.
For example, a development team may set internal criteria such as:
At least 3 technical replicates for key binding measurements.
CV below 20% for routine quantitative results, unless the assay is exploratory.
At least 10-fold separation between positive and negative controls where practical.
Confirmation in two independent assay formats.
100% review of raw sensorgrams or flow-cytometry gating for final candidates.
These are project-specific examples, not universal regulatory limits. Laboratories operating under a quality system may align documentation and competence practices with ISO/IEC 17025. ASTM E691 can inform interlaboratory precision studies, but it is not a universal affinity acceptance standard for VHHs. There is no single ASTM or DIN pass-fail value that defines a good nanobody.
How to Interpret Binding Results as a Complete Workflow
Step 1: Confirm Sequence Identity and Display Quality
Before interpreting affinity, verify the VHH sequence, reading frame, linker, display anchor, and expression marker. Display level should be measured because a high fluorescence signal may reflect high expression rather than strong intrinsic affinity.
Step 2: Remove Obvious Artifacts
Review enrichment against empty yeast, irrelevant antigen, tag-only antigen, and no-antigen controls. Eliminate clones with broad sticky binding, excessive background, or a strong dependence on a purification tag that will not be present in the final application.
Step 3: Rank by a Metric Panel, Not One Number
A practical ranking matrix can assign weighted scores to affinity, kinetics, specificity, expression, stability, epitope, and reproducibility. For instance, a team might give 30% weight to KD and kinetics, 25% to specificity, 15% to expression and purification, 15% to thermal stability, and 15% to epitope or application performance.
The exact weighting should match the product goal. A rapid-capture diagnostic may prioritize kon, while a blocking therapeutic program may prioritize epitope and residence time.
Step 4: Confirm in a Purified Format
Express selected VHHs as soluble monomers, purify them, and repeat binding analysis. SPR and BLI can provide kinetic data, while ELISA or flow cytometry can provide orthogonal confirmation. If results differ substantially, investigate aggregation, ligand immobilization, target folding, mass transport, or avidity.
Step 5: Add Developability Filters
Binding performance is only one part of lead quality. Include size-exclusion chromatography, monodispersity, thermal shift or differential scanning fluorimetry, protease sensitivity, expression yield, and freeze-thaw performance where relevant. A VHH with a KD of 1 nM may be less valuable than a stable 10 nM VHH that expresses at 50 mg/L and retains activity after storage.
Illustrative Case Study: Why the Best FACS Signal Was Not the Best Lead
Consider an illustrative screening campaign that produced 120 sequence-unique VHH clones. Ten clones showed strong FACS enrichment. After normalization to display level, six remained positive. Purified monomer testing then produced the following results:
Candidate group
Cell-based signal
Purified KD
Specificity
Decision
Group 1
Very high
2 nM
Target-specific
Advance
Group 2
Very high
180 nM
Strong tag binding
Reject
Group 3
Moderate
12 nM
Target-specific, slow koff
Advance
Group 2 initially looked attractive because of its bright FACS signal. However, purification and tag-only controls revealed a specificity problem. Group 3 had a lower cell-based signal but stronger monovalent performance and a slower dissociation rate. This example demonstrates why VHH candidate ranking should integrate display level, KD, koff, and specificity rather than selecting the brightest population.
Common Misconceptions About VHH Binding Metrics
Misconception 1: The Lowest KD Always Wins
Clarification: KD is important, but it does not describe stability, specificity, expression yield, aggregation, or in-matrix performance. A balanced candidate often provides greater commercial value than the strongest binder in one assay.
Misconception 2: FACS Enrichment Proves High Affinity
Clarification: Enrichment may reflect expression level, avidity, antigen density, or nonspecific interactions. Soluble monomer confirmation is necessary.
Clarification: ELISA is useful for endpoint comparison but generally does not directly provide reliable kon and koff values. SPR or BLI is more suitable for kinetic characterization when the assay is properly designed.
Misconception 4: One Assay Format Is Enough
Clarification: Immobilization and labeling can alter antigen conformation. Orthogonal formats reduce the risk of advancing an assay-specific artifact.
Misconception 5: Industry Standards Define One Universal Affinity Threshold
Clarification: ASTM and DIN standards may support laboratory quality, measurement practice, or material testing, but they do not establish one universal KD threshold for all VHH programs. Acceptance criteria must be linked to the intended application and validated assay performance.
What a High-Quality Yeast Display VHH Screening Service Should Report
A professional Yeast Display VHH Screening Service should provide more than a final clone list. A useful technical package normally includes:
Screening strategy, antigen format, and selection pressure.
FACS plots, gating logic, negative controls, and enrichment data.
Sequence identity and sequence-unique clone information.
Display-normalized binding results.
KD, kon, koff, assay temperature, buffer, and fitting model where measured.
Specificity, cross-reactivity, and competition results.
Expression, purification yield, aggregation, and stability observations.
Raw-data review and documented deviation handling.
For project execution, clear service specifications are also valuable. Examples include a written screening plan before laboratory work, a 24-hour response target for urgent data questions, and 100% inspection of final sequence and report records. Such commitments should be verified in the actual service agreement rather than assumed from marketing language.
Practical Decision Rules for VHH Candidate Selection
When deciding which binding metrics matter after yeast display VHH screening, use the following practical sequence:
Remove nonspecific binders first. Specificity failures cannot usually be repaired by a lower KD.
Confirm monovalent affinity. Compare soluble VHH data with yeast-display results.
Review koff for the use case. Residence time may matter more than rapid association in some applications.
Check reproducibility. Repeat critical measurements and investigate large discrepancies.
Evaluate epitope and competition. Select functional diversity rather than only sequence diversity.
Apply developability filters. Expression, solubility, stability, and aggregation can determine manufacturing feasibility.
Test the intended matrix. A VHH that binds purified antigen may behave differently in serum, lysate, or tissue samples.
Final Takeaways for Yeast Display VHH Programs
Which Binding Metrics Matter After Yeast Display VHH Screening is best answered with a complete metric panel rather than a single affinity value. KD provides an overall equilibrium view; kon and koff explain binding speed and residence time; specificity and competition reveal biological relevance; and reproducibility shows whether the result can support a reliable development decision.
The most defensible workflow combines yeast-display enrichment, purified monomer testing, orthogonal assay confirmation, and developability assessment. Whether a team works with NBbiolab or another qualified provider, it should request transparent controls, raw-data interpretation, defined acceptance criteria, and application-specific recommendations. By reviewing these measurements together, researchers can move from attractive screening signals to VHH candidates with stronger technical and commercial potential.
Previous:
How Epitope Location Influences ADC Nanobody Performance
Next:
How to Plan Nanobody Discovery from Antigen to Lead Candidate



 Yeast Display VHH Discovery Service
 Immunogen Design & Production
 Premade Library Screening
 Phage Display Nanobody Discovery Service
 Animal Immunization
 Yeast Display Peptide Library Screening

 Nanobody Discovery for ADC
 Nanobody Discovery for Membrane Targets
 Nanobody Discovery for Cell Therapy
 TCR-Mimic Nanobody Discovery


 Antibody Affinity Maturation Service
 Nanobody Humanization Service